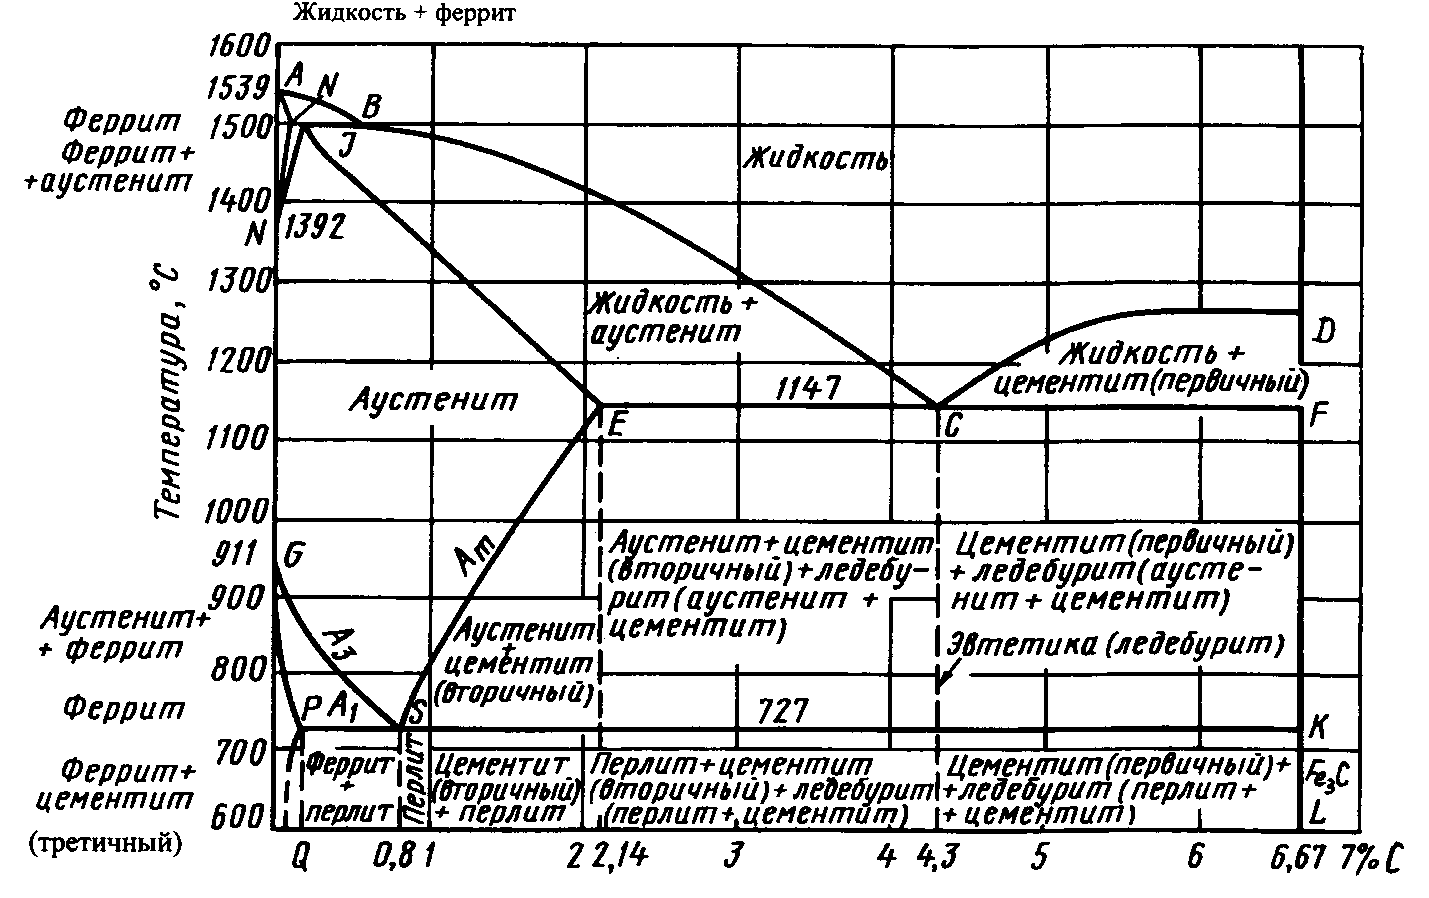
Phase diagrams are graphs of how material structure depends on temperature conditions and the concentration of certain chemical elements and compounds in steel or alloy composition. They are a fundamental tool in the arsenal of metallurgists, materials scientists, and engineers and make it possible not only to “look inside” a material but also to predict its behavior under various heat-treatment conditions.
What a phase diagram is
An alloy phase diagram is a graphical representation showing which phases (solid solutions, liquid, intermediate compounds, etc.) are present in the system at different temperatures and component concentrations. It is a kind of map illustrating phase changes in a material from the liquid state to full solidification.
Why phase diagrams matter so much
Phase diagrams underlie prediction of steel and alloy behavior, their properties, and choice of processing methods.
Main reasons why phase diagrams are indispensable:
- Predicting alloy properties. They make it possible to assess how structure and, accordingly, alloy properties will change during heat treatment or composition change, which is critically important for precision alloys and special steels.
- Developing and optimizing process technologies. Using diagrams one can select optimal regimes of casting, quenching, annealing, and other operations to obtain the required properties and structure.
- Control of phase transformations. Diagrams make it possible to track transitions between states (phases) of a physical system when temperature and composition change. This helps understand mechanisms of forming steel or alloy structure and their properties.
Thus phase diagrams are not merely teaching material, but a real navigator in industrial metallurgy.
Terminology basics: components, phases, and equilibrium
To interpret diagrams correctly it is important to understand key terms:
- Components — chemical elements or compounds that enter alloy composition and determine its properties. Components may take the form of:
- pure metals: for example iron and nickel in precision soft magnetic alloys;
- intermetallics: compounds of metals with each other;
- other chemical compounds.
- Phases — homogeneous regions of a material that have the same composition, structure, and properties. Several phases may exist simultaneously in an alloy (solid solutions, intermediate phases, pure components, etc.), each with its own physical and mechanical characteristics.
- Phase rule (Gibbs phase rule) — determines the number of degrees of freedom of a system, that is the number of parameters (composition, pressure, temperature) that can be changed independently of each other without changing the number of phases in the system.
Phase-rule formula: F = C − P + 2, where:
- F — number of degrees of freedom;
- P — number of phases;
- C — components in the equilibrium system;
- 2 — external equilibrium factors (temperature and pressure).
- Phase equilibrium — a system state in which all phases are in thermodynamic equilibrium with each other. In that state free energy in the system is minimal, and no changes of composition or structure occur.
- Phase transformations — transition of a substance from one phase to another when temperature, pressure, or composition changes. For example, on cooling an alloy crystallization of liquid melt into a solid phase may occur, and on heating — melting of the solid phase.
- Phase compositions — quantitative ratio of components in each phase. Determined from phase diagrams and depend on overall system composition, pressure, and temperature.
Knowledge of phase compositions makes it possible to predict material properties and its behavior under various processing and service conditions.
How to read phase diagrams
Each diagram reveals unique information about a steel or alloy. Binary and multicomponent system diagrams are especially important.
Binary alloy phase diagrams
Simple and informative, they show phase equilibria in systems of two components. They are graphs with component concentrations on the X axis and temperature on the Y axis. They help determine which phases form at various temperatures and concentrations and predict alloy properties. They are the foundation for understanding crystallization and phase-transformation processes.
Main elements:
- single-phase regions — areas where only one phase exists (for example pure components or a solid solution);
- liquidus and solidus lines — lines marking temperatures of the start and end of crystallization;
- phase regions — areas where two or more phases are present in the alloy.
Examples of binary alloys:
- soft magnetic alloys:
- 49K2FA-VI — a precision iron–cobalt-based alloy,
- 50N — an iron–nickel alloy with high magnetic saturation;
- alloys with high electrical resistivity:
- Kh15N60-N, Kh20N80-N — heat-resistant nickel–chromium alloys with operating temperature above 1100°C.
Multicomponent alloy phase diagrams
More complex and multifaceted than binary alloy diagrams because they describe interaction among three or more components. Multicomponent diagrams help analyze each component’s effect on material properties and predict its behavior under various conditions. They can be presented as three-dimensional graphs or sections showing phase equilibria at various combinations of component concentrations.
Features:
- structural complexity — presence of many phase regions and equilibrium lines;
- ability to optimize composition — selecting the optimal component ratio to achieve required properties;
- predicting combined effects — analyzing how interactions among components affect phase transformations and alloy properties.
Examples of multicomponent alloys:
- soft magnetic:
- 79NM, 80NM, 81NMA — alloys with high nickel (up to 81%) and molybdenum content;
- with specified elastic properties:
- 17KhNGT — contains chromium, nickel, manganese, and titanium; combines elasticity with high corrosion resistance
- 36NKhTYu — an iron–chromium–nickel alloy with high ductility and elevated corrosion resistance;
- 40KKhNM — a strong, wear-resistant material with high cobalt, chromium, and molybdenum content.
- corrosion-resistant:
- heat-resistant:
- KhN78T — a nickel alloy used in turbines, jet engines, and other equipment requiring elevated heat resistance.
Interesting fact
The Fe–C (iron–carbon) system diagram underlies modern steelmaking. Hundreds of steel grades were created with its help — from soft structural grades to tool steels.
Constructing and analyzing phase diagrams
Creating a diagram is painstaking work that includes both experimental and computational methods. In materials science and thermodynamics, constructing and analyzing such graphs makes it possible to understand phase equilibria and material properties depending on melting and processing temperature conditions, applied pressure, and chemical composition. Modern science offers many approaches to this important process.
Experimental methods:
- Differential scanning calorimetry (DSC) — makes it possible to determine phase-transition temperatures and thermal effects. It measures the difference in heat quantity needed to heat a specimen and a reference under the same temperature regime.
- X-ray diffraction analysis (XRD) — uses X-ray radiation to determine the crystal structure of materials: identify phases and features of their change depending on specific conditions.
- Solidification-from-melt method — consists in heating steel or alloy to the liquid state and then slowly cooling it. Temperatures of the start and end of crystallization of each phase are recorded.
- Thermal analysis — recording thermal effects occurring in an alloy when temperature changes. The method makes it possible to determine temperature ranges of phase transformations.
Computer modeling and calculation of diagrams:
- First-principles modeling, including density functional theory (DFT), — makes it possible to calculate material properties based on quantum-mechanical equations. Used to predict phase diagrams that include a large number of components.
- Monte Carlo method — a mathematical modeling method by generating random variables. Can be used to calculate thermodynamic properties and construct phase diagrams.
- Artificial intelligence and machine learning — these methods can be applied to analyze large volumes of experimental data and predict phase diagrams based on identified patterns.
What can be learned from a phase diagram
Knowledge of diagram structure makes it possible to solve major applied problems.
Main conclusions that can be drawn:
- Determining phase regions — on a state graph one can determine regions corresponding to various material phases. This helps understand which phases can exist under certain conditions.
- Analyzing phase boundaries — studying boundaries between phases makes it possible to understand phase-transition conditions and phase stability.
- Predicting material behavior — based on modeled graphic images one can predict material behavior under various conditions such as changes of temperature, pressure, or composition.
- Optimizing compositions and processing conditions — a phase diagram can be used to optimize alloy compositions and their processing conditions to achieve desired properties.
Interesting fact
The Al–Cu (aluminum–copper) diagram became the starting point for creating duralumin — a group of high-strength alloys for cosmonautics and aircraft construction. Precisely the state-dependence graph helped determine optimal composition and heat-treatment regime, providing a unique combination of lightness and strength.
Phase diagrams — a practical guide to developing new steels and alloys
Constructing phase diagrams makes it possible to obtain a graphic image of material structural composition and visualize phase changes depending on temperature and component composition. Understanding these diagrams helps predict material behavior under various processing conditions, determine optimal processing temperatures, and analyze mechanical and process properties of steels and alloys.
Using phase diagrams, engineers and scientists determine conditions under which phase transitions occur, which is necessary for quality control and preventing unwanted changes in material structure. Therefore it is practically impossible to overstate the value of these graphic images for modern industry and scientific research. They not only deepen understanding of fundamental materials-science principles but also serve as a practical guide to developing new materials and improving existing process technologies.
If you need high-quality precision alloys or steel processing services — contact our sales department. We will help select the right composition, calculate heat-treatment parameters, and provide qualified technical support. Contact us today — and together we will solve any metallurgical task!